

-55%


Price: ₹1,598 - ₹719.10
(as of Oct 30, 2024 22:41:30 UTC – Details)

Product Description

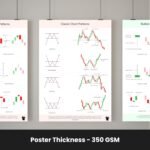
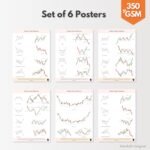
The collection comprises six distinct posters featuring classic chart patterns. Each poster, crafted on 350 GSM paper, offers a vivid and well-defined display. The dimensions of each poster are 35cm x 24.8cm.

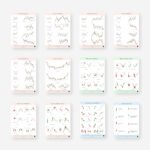
The collection comprises six distinct posters featuring candlestick chart patterns. Each poster, crafted on 350 GSM paper, offers a vivid and well-defined display. The dimensions of each poster are 35cm x 24.8cm.

Classic chart patterns are visual representations of price movements on a stock chart that traders and analysts use to identify potential trends, reversals, and consolidation phases in the stock market. These patterns have stood the test of time and are widely recognized among traders. They are formed by the historical price data of a stock, and traders analyze them to make informed decisions about their trading strategies.
Traders analyze these patterns in conjunction with other technical indicators and fundamental analysis to make trading decisions. Therefore, traders often combine chart pattern analysis with risk management techniques to mitigate potential losses.
Predictive Insights – Provide traders with predictive insights into potential price movements. Entry and Exit Signals – Allows to trade more effectively, maximising profits and minimising losses. Visual Representation – This visual approach simplifies complex market data.

A candlestick chart pattern is a popular and visually intuitive method used in financial analysis to represent the price movements of an asset, such as stocks, commodities, or currencies, over a specific period of time.Each candlestick consists of a rectangular body and two thin lines extending from it, referred to as wicks or shadows. The body represents the price range between the opening and closing prices during a given time period, while the wicks indicate the highest and lowest prices reached within that period.
Traders and analysts use these patterns to identify trends, reversals, and potential entry or exit points for trades. Some well-known candlestick patterns include doji, hammer, engulfing, and shooting star, each carrying its own significance and implications for market behavior.
Bullish (Upward Trend): Closing price higher than opening price (often green or white). Bearish (Downward Trend): Closing price lower than opening price (often red or black). Upper and lower wicks: Indicate highest and lowest prices within the period.

Risk Management – Traders can set stop-loss orders based on key levels within the patterns. In risk management, traders have a valuable tool at their disposal when working with classic chart patterns. These patterns often have specific key levels, like support and resistance points, which can be crucial for making decisions about when to exit a trade. his approach helps traders manage risk by ensuring that they don’t hold on to a losing position for too long, potentially saving them from larger financial losses. It’s an essential aspect of using classic chart patterns effectively for trading.
Confirmation with Other Indicators – When indicators align,traders gain confidence in their strategy. Some indicators, such as the Moving Average Convergence Divergence (MACD) or volume indicators, provide insights into market sentiment. When these indicators align with a chart pattern, it can signal a strong consensus in the market, adding confidence to a trade. Confirmation with other indicators in trading involves using complementary tools to corroborate the signals generated by classic chart patterns.

Confirming Support and Resistance Levels:Patterns such as doji and spinning tops can signal market indecision and are often used to confirm support or resistance levels. Traders look for these patterns near key price levels to gauge potential price reversals or continuations.
Entry and Exit Points:Bullish patterns may be used as signals to enter long positions (buy), while bearish patterns can be used as signals to enter short positions (sell).Traders often combine candlestick patterns with other technical indicators to strengthen their entry and exit strategies.


High-Resolution Printing
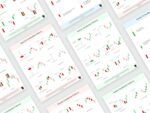
High-quality images and graphics are used to prevent pixelation. Posters are sharp and clear enough because of high quality images.
Paper Material
350 GSM thick paper is used to maintain durability, matte and glossy finish and strength in posters.
Eye-Catching Graphics
High-resolution graphics that are visually appealing and relevant to the theme of the stock market poster.
Font Size and Spacing
The text is large enough to be easily read from a reasonable distance.
📈 Comprehensive: Covers all major Candlestick and Classic Chart Patterns for profitable trades.
🔍 Detailed: Provides in-depth insights into 42 Candlestick patterns and 24 Chart patterns for precise analysis.
🎨 High Quality: Laser-printed on 350 gsm glossy paper for sharp, clear images that stand out.
🚀 Edge in Trading: Gain an edge in the market with accurate pattern recognition and trading strategies.
💡 Perfect for traders of all levels, from beginners to seasoned professionals.
🔒 Easy to Use: Comes with set of 2 thin double sided tape for effortless mounting, keeping them handy for quick reference.
No account yet?
Create an Account